



Read the expectation.
Combine the market’s closing price with its matching volatility index: S&P 500 and VIX, for example. Gold and oil use volatility measures derived from options on the corresponding ETFs.
SPX / VIX · ES
PRICE. TIME. VOLUME. VOLATILITY.
Bouhmidi Bands turn implied volatility into a clear range for the trading day. See where a move stands against what options markets price in — and bring that perspective to your own strategy.
What are Bouhmidi Bands?ONE FRAMEWORK. YOUR PLATFORM.
Available on TradingView, ProRealTime / IG and tastytrade.
01 / CURRENT BANDS
Here you can see the current Bouhmidi Bands at 1σ, 1.5σ and 2σ, based on the previous closing prices of each market and its volatility index.
| Market | IV source | −2σ | −1.5σ | −1σ | Reference | +1σ | +1.5σ | +2σ |
|---|---|---|---|---|---|---|---|---|
| S&P 500Scheduled session · 2026-09-10Reference close · 2026-09-09 | VIX16.46% | 7,478.00 | 7,517.59 | 7,557.18 | 7,636.36 | 7,715.54 | 7,755.13 | 7,794.72 |
| E-mini S&P 500ESU26Scheduled session · 2026-09-10Reference close · 2026-09-09 | VIX16.46% | 7,485.24 | 7,524.86 | 7,564.49 | 7,643.75 | 7,723.01 | 7,762.64 | 7,802.26 |
| Nasdaq-100Scheduled session · 2026-09-10Reference close · 2026-09-09 | VXN22.32% | 28,594.20 | 28,801.04 | 29,007.87 | 29,421.55 | 29,835.23 | 30,042.06 | 30,248.90 |
| Dow Jones Industrial AverageScheduled session · 2026-09-10Reference close · 2026-09-09 | VXD15.50% | 51,357.76 | 51,613.49 | 51,869.21 | 52,380.66 | 52,892.11 | 53,147.83 | 53,403.56 |
| COMEX GoldGCZ26Provider correction detected · published levels retained · 2026-09-10Reference close · 2026-09-09 | GVZ27.79% | 4,289.56 | 4,328.47 | 4,367.38 | 4,445.20 | 4,523.02 | 4,561.93 | 4,600.84 |
| WTI Crude OilCLV26Provider correction detected · published levels retained · 2026-09-10Reference close · 2026-09-09 | OVX49.85% | 90.95 | 92.47 | 93.99 | 97.04 | 100.09 | 101.61 | 103.13 |
Automatic updates after the US market close.
Closing-price sources: Yahoo Finance · Cboe
02 / READ THE BANDS
A band test or breakout gains meaning from the wider session. Read price structure, timing, participation and implied volatility together, then bring your own setup and risk rules to the move.
Combine the market’s closing price with its matching volatility index: S&P 500 and VIX, for example. Gold and oil use volatility measures derived from options on the corresponding ETFs.
Scale annualized volatility to one session. Plot 1σ, 1.5σ and 2σ bands above and below the previous close.
The levels remain fixed during the session. Read price against them alongside timing and volume. The same band event can carry a different meaning in a different market context.
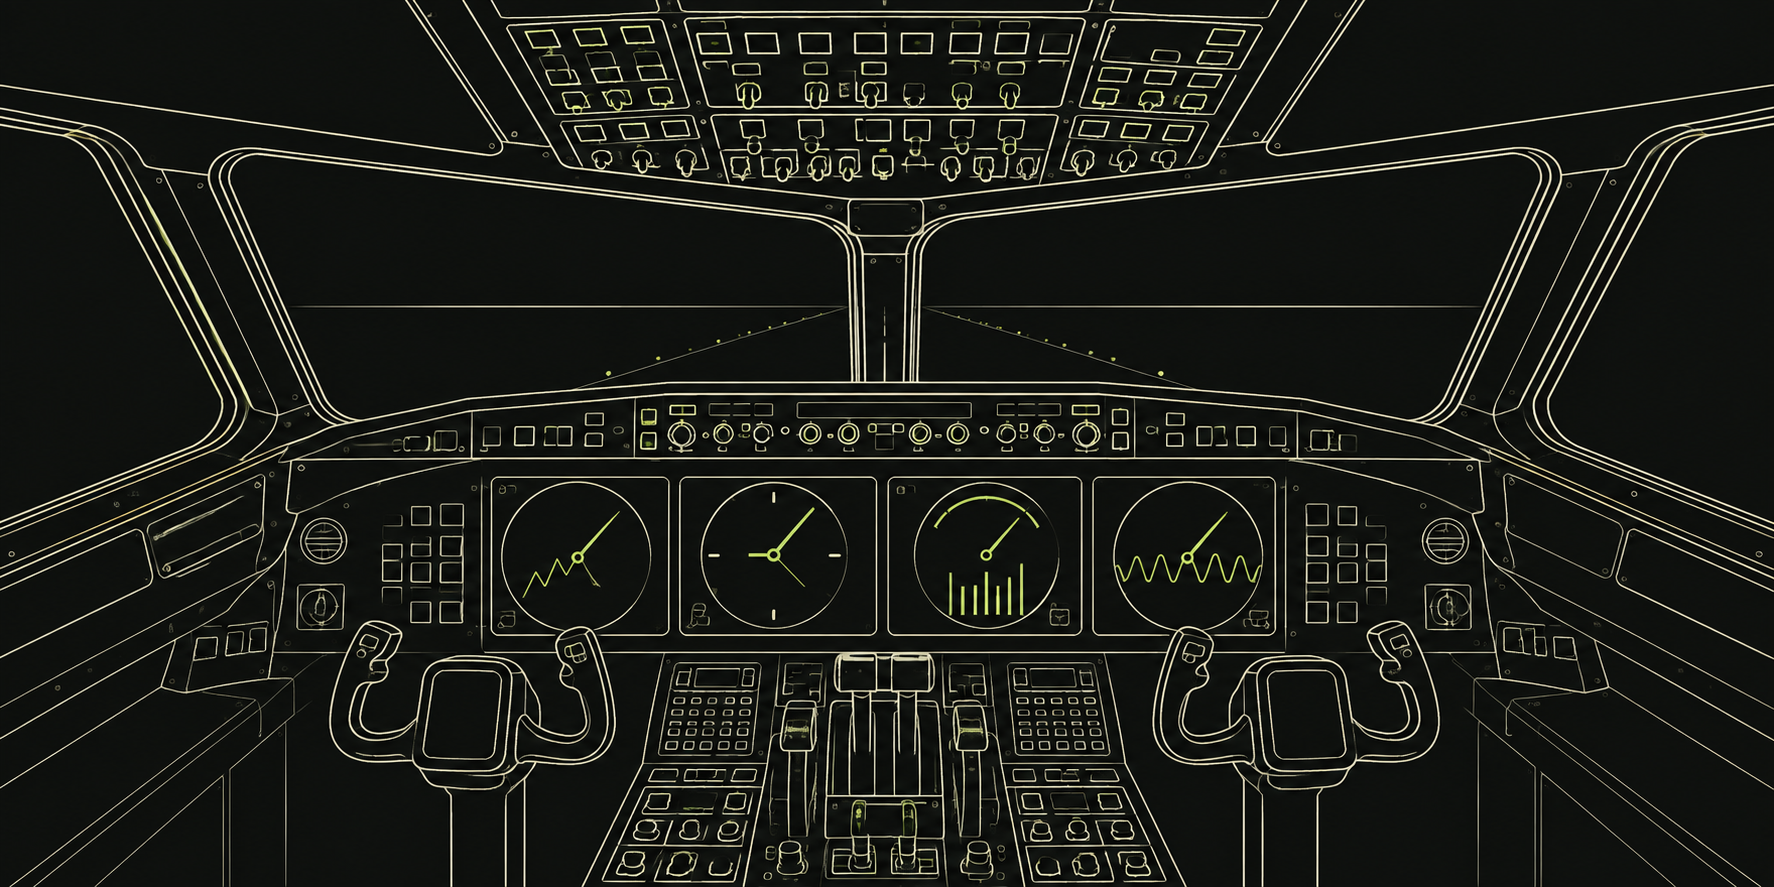
THE TRADER’S COCKPIT
First, understand price and time. Volume adds the activity behind the move. Bouhmidi Bands add implied volatility: how much movement is priced in. Like instruments in a cockpit, each becomes more useful when read with the others. Understanding the current situation means bringing the whole panel into view.
Understand the structure of the move.
Read its timing and sequence.
Assess the activity behind it.
Put its size against what is priced in.
03 / RESEARCH, IN FOCUS
The findings behind the framework. Explore the moments that change how you read a session.
An early band contact gives the session a different context.
A brief re-entry and the final close answer different questions.
The opening location and first-hour move belong in the same picture.
Measure the opening range against the movement already priced in.
Historical cash-index observations using a 252-trading-day annualization basis. Intraday results are descriptive, in sample, and do not measure trading returns. The quoted rates are not separately validated futures or options execution results.
THE RESEARCH BACKBONE
04 / THE ANALYST
Market analyst. Quant. Trader.
Salah-Eddine Bouhmidi developed Bouhmidi Bands to bring the missing dimension of implied volatility into his approach to price, time and volume. Shaped by his trading experience and quantitative research, the bands help him read the current market context.
View profileThe edge comes from understanding how all four dimensions work together.
LET’S TALK MARKETS
For research conversations, media enquiries and questions about the bands.